
Batter Lab
A baseball stats site you talk to: type "Aaron Judge 2024" or "compare Ohtani and Judge home runs since 2021" and it builds a dashboard from every season since 1901 — then keeps changing it as you ask for more.
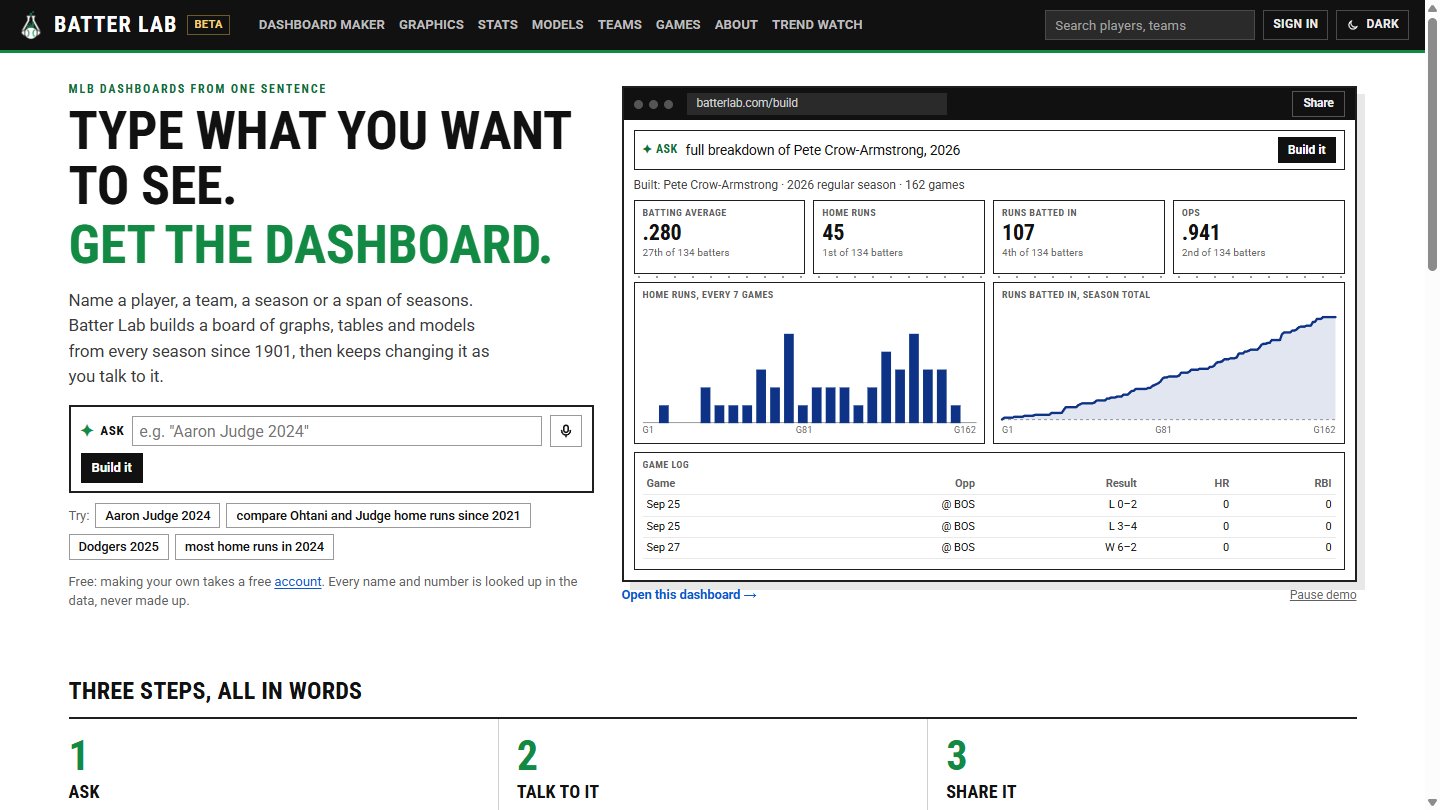
Batter Lab brings the one-sentence dashboard maker to baseball. Name a player, a club, a season or a span of them, and it builds a board of stat tiles, charts and tables; follow up to add a player, trim it to the charts or switch seasons.
Baseball counts differently from the other sports. A season is one calendar year, batters and pitchers are different kinds of player with different numbers, and the long history matters — so the site goes back to 1901, built on Retrosheet's records and credited on every page.
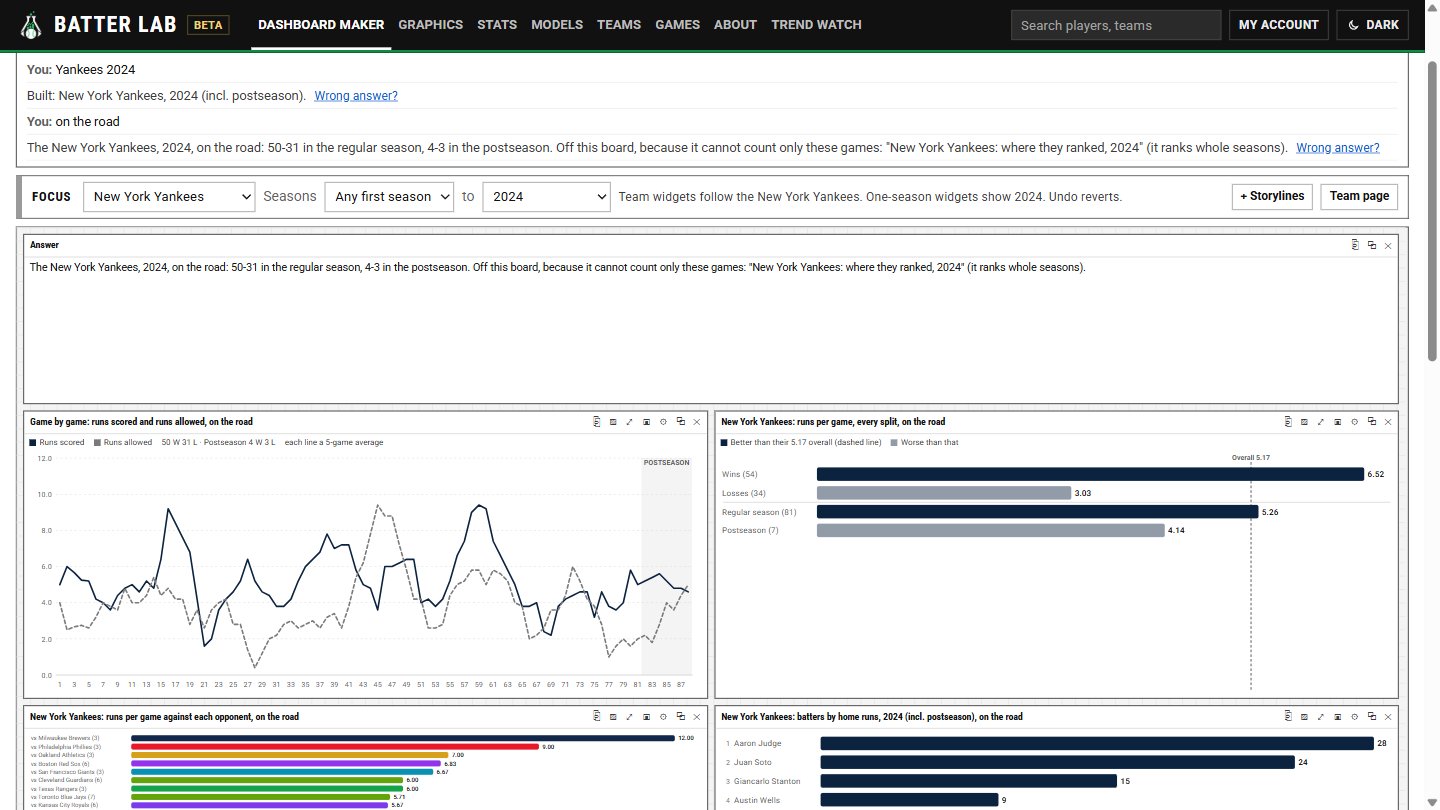
Follow-ups work on the whole board: "Yankees 2024", then "on the road", and every chart narrows to those games. In edit mode widgets can be moved, resized, copied and pasted.
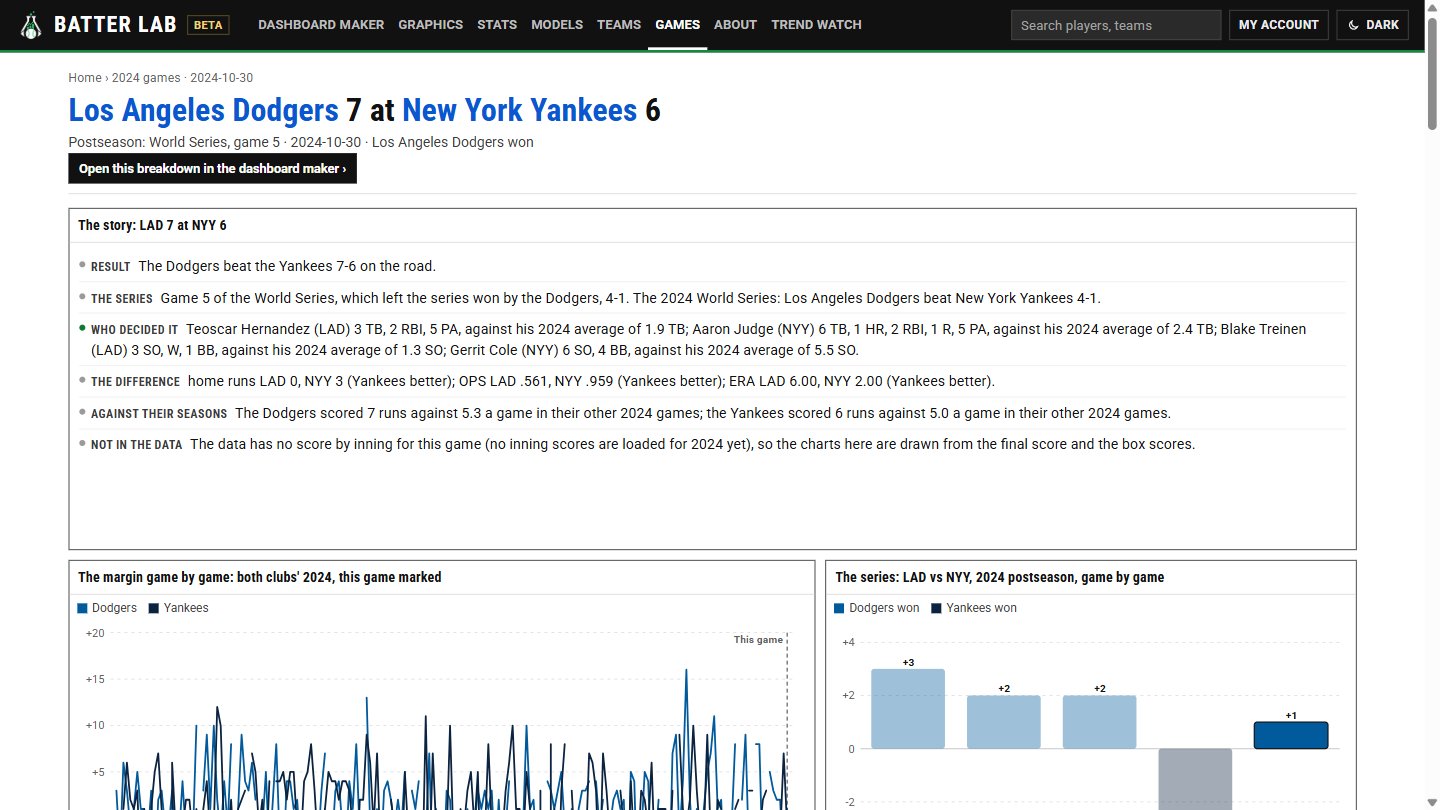
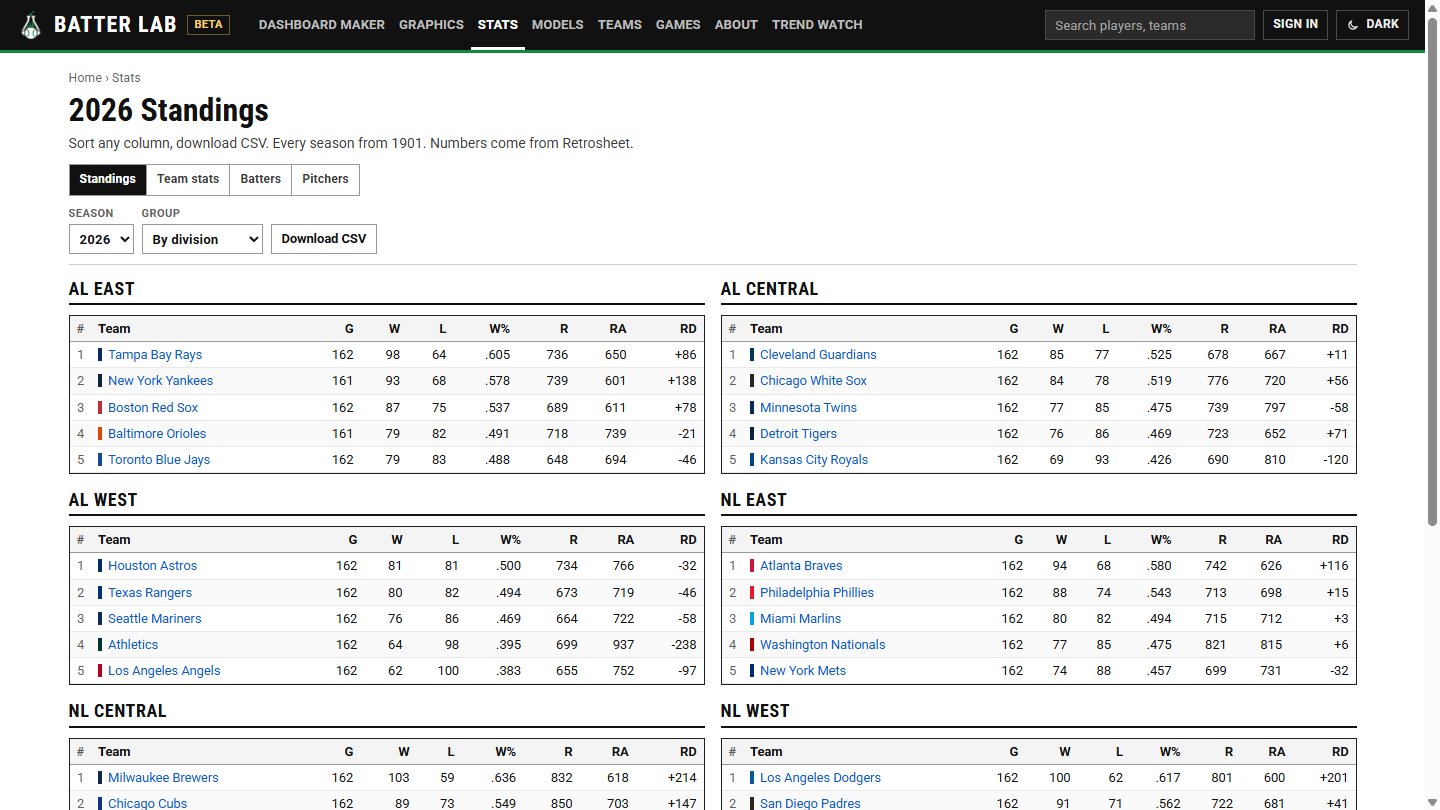
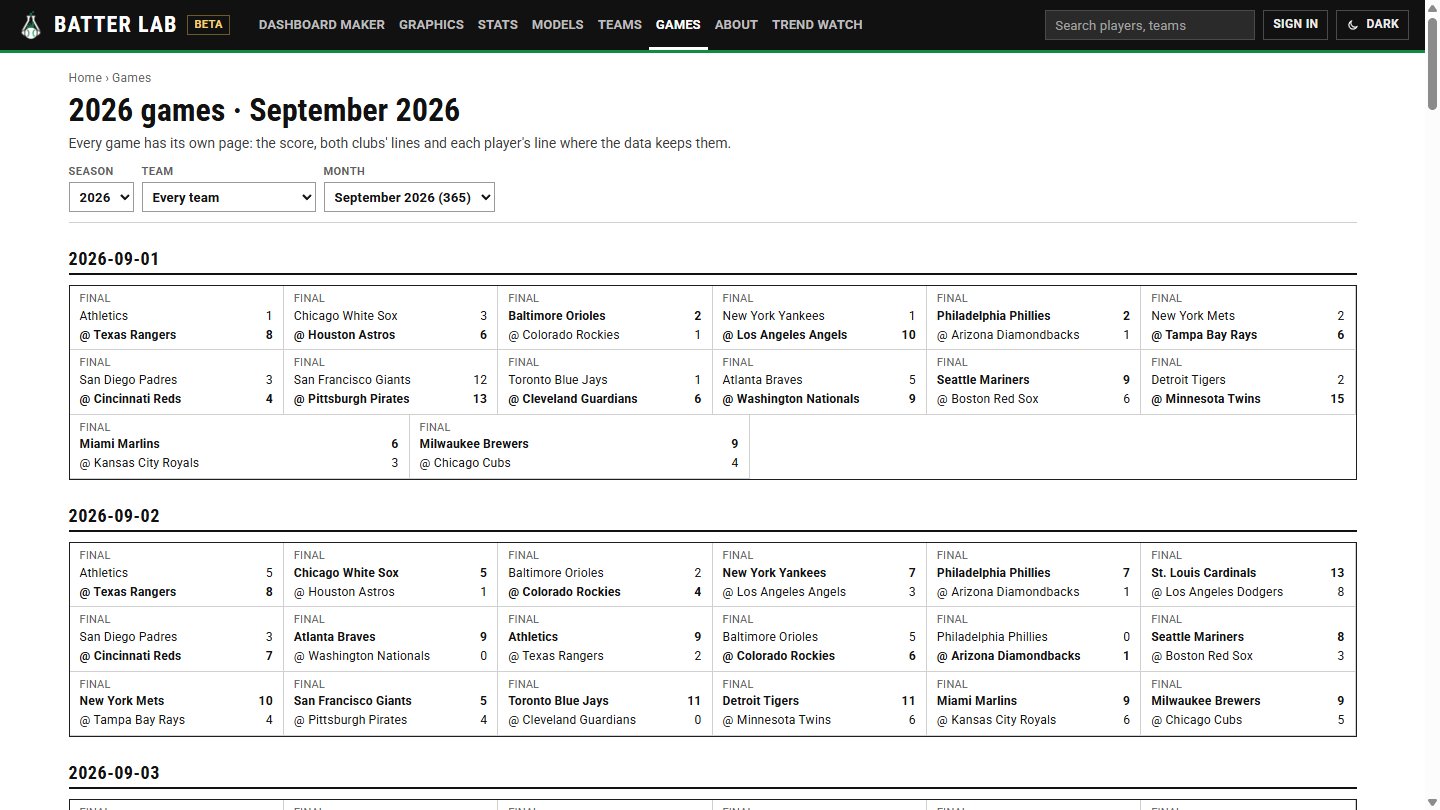
Every game has its own page that opens with its story — who decided it, the difference, the series — over a stack of charts; standings show run differential for every club, and a Models page sets each club's wins against what its runs scored and allowed say it should have won.
It shares one engine with HoopVision Lab and Rinkside Lab, so a fix made once reaches all three sites.
What it does
- Type a sentence, get a dashboard; follow up to change it
- Every season since 1901
- Batters and pitchers, each with their own tables
- Whole-board follow-ups: "on the road" or "after a loss" narrows every widget at once
- A page for every game that tells its story over a stack of charts, and a daily scoreboard by month
- Standings with run differential, sortable
- Expected wins from runs scored and allowed, against the wins a club really got
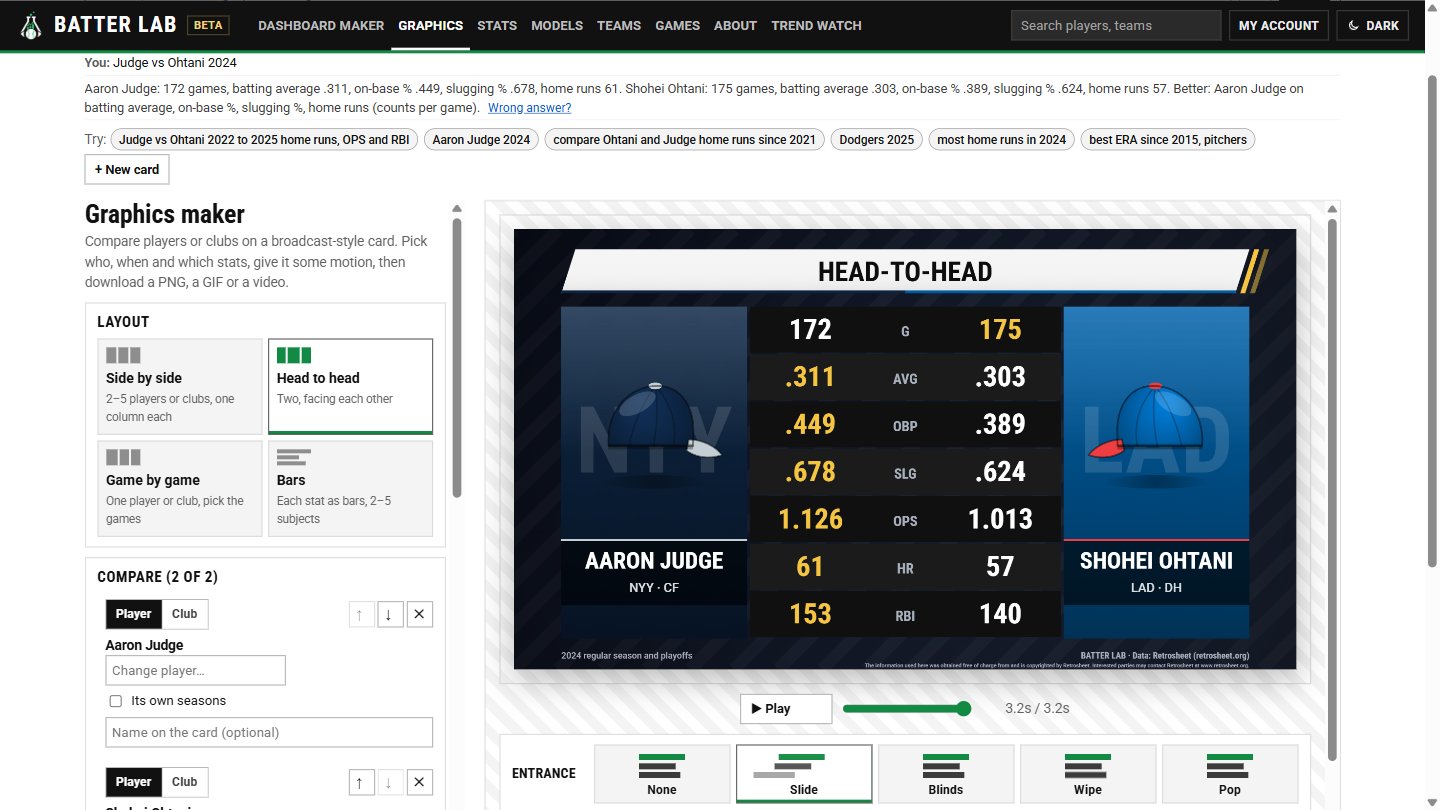
- A graphics maker for broadcast-style comparison cards
- Edit mode with copy and paste; share links, board themes and picture export