
HoopVision Lab
An NBA stats site you talk to: type "Nikola Jokic 2023-24" or "most points per game in 2024-25" and it builds a dashboard of charts and tables from every season since 1946-47 — then keeps changing it as you ask for more.
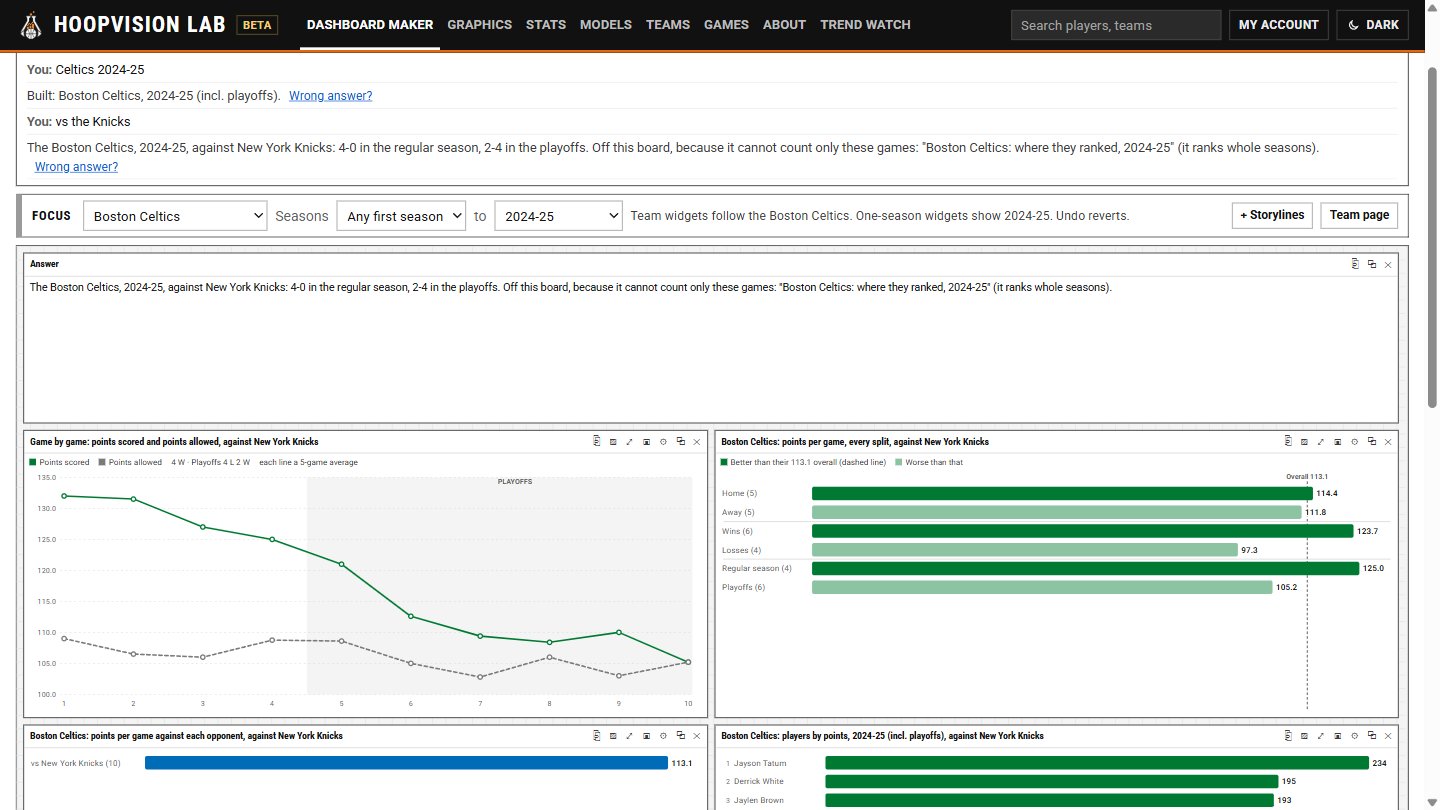
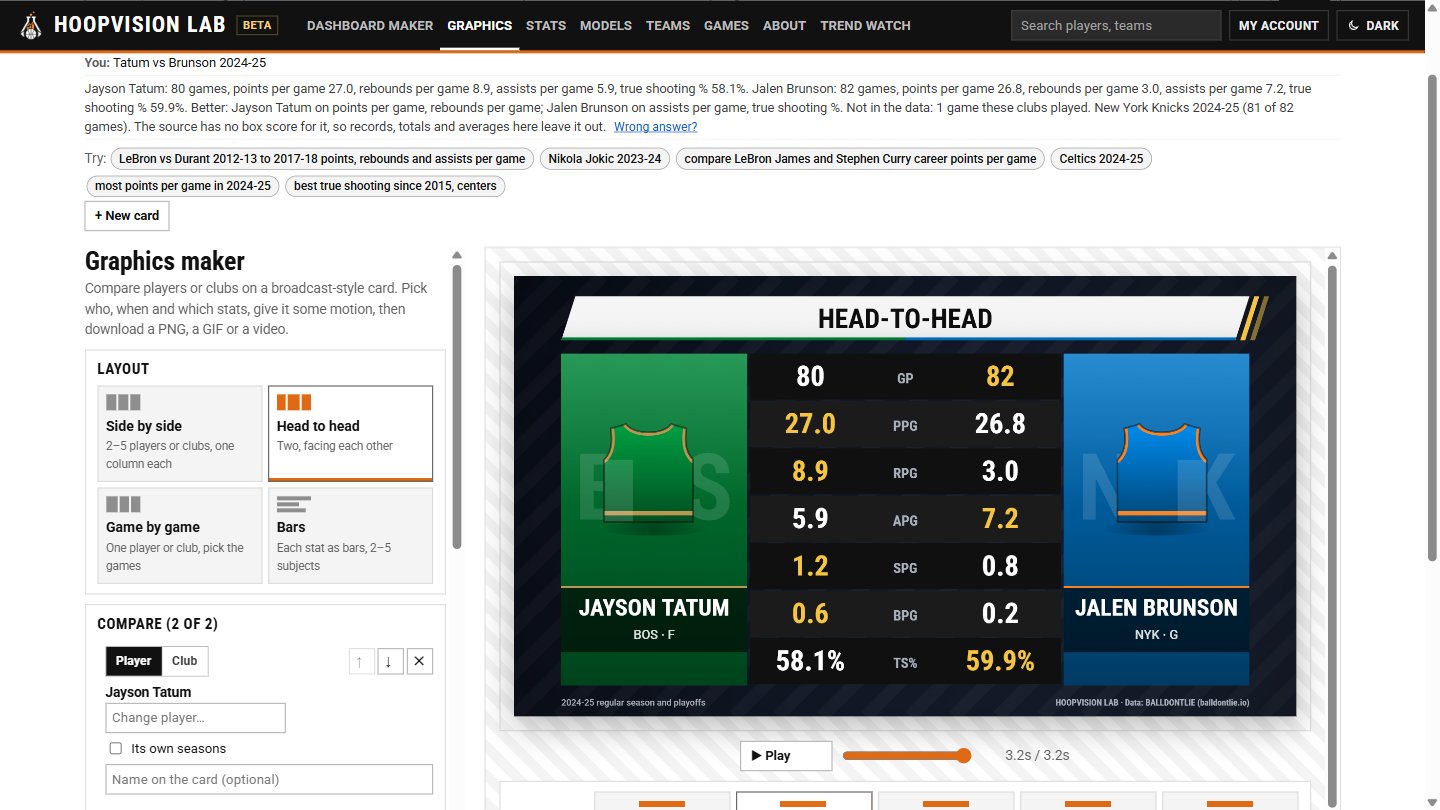
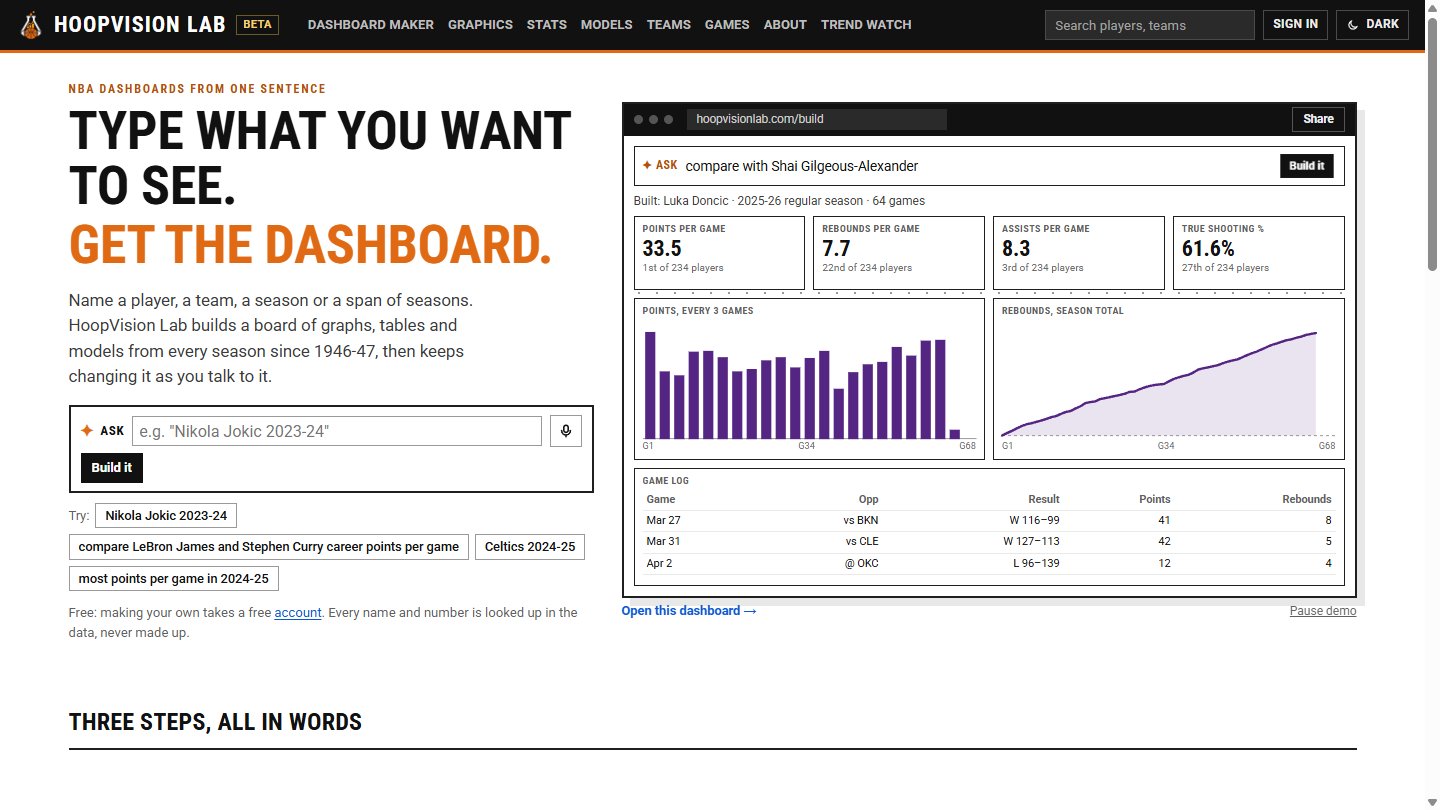
HoopVision Lab is Pigskin Lab's idea taken to basketball. You type what you want to see — a player's season, two players side by side, a team across a decade, the league leaders — and it builds a finished dashboard of stat tiles, charts and tables. Then you keep talking to it: "add Luka Doncic", "only the charts", "now the playoffs". Questions get a sentence of answer on top of the board, written from the same numbers the charts draw.
Basketball needed its own thinking. A season spans two calendar years, playoff rounds have to be worked out from the games themselves, and "a 30-point season" means thirty a game, the way the NBA says it. The site knows all of that, and it goes back to the league's very first season in 1946-47.
Follow-ups work on the whole board: "Celtics 2024-25", then "vs the Knicks", and every chart on it narrows to those games. In edit mode widgets can be moved, resized, copied and pasted.
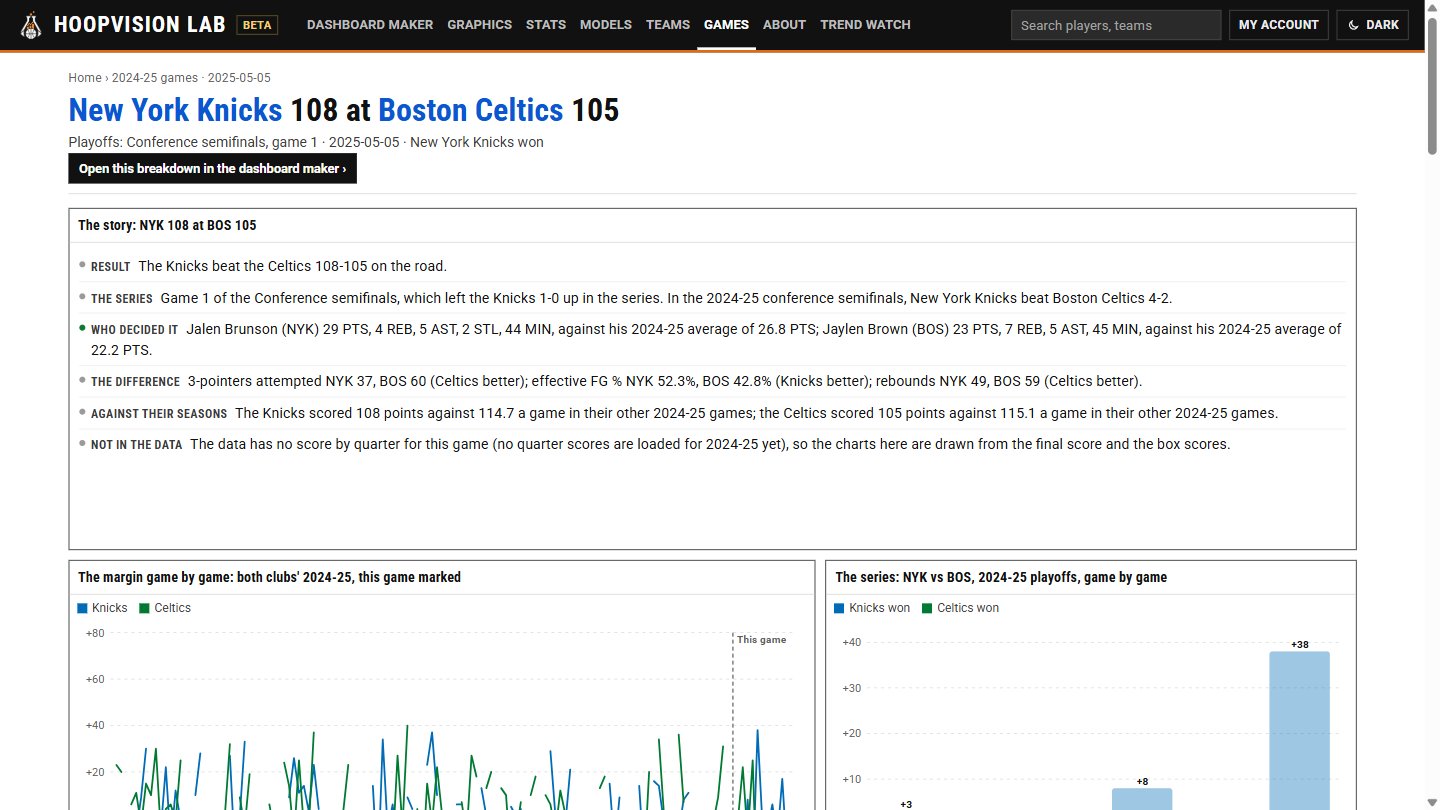
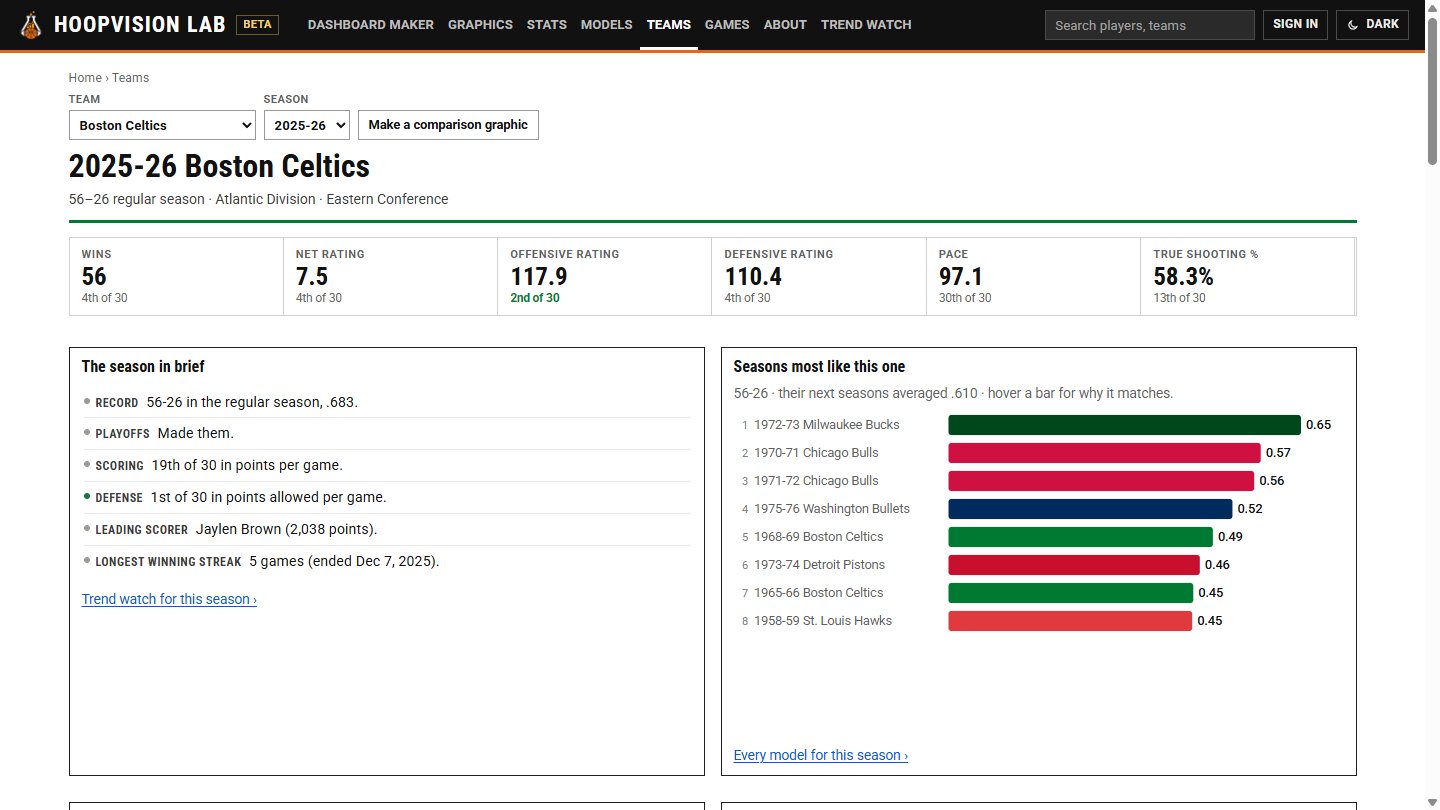
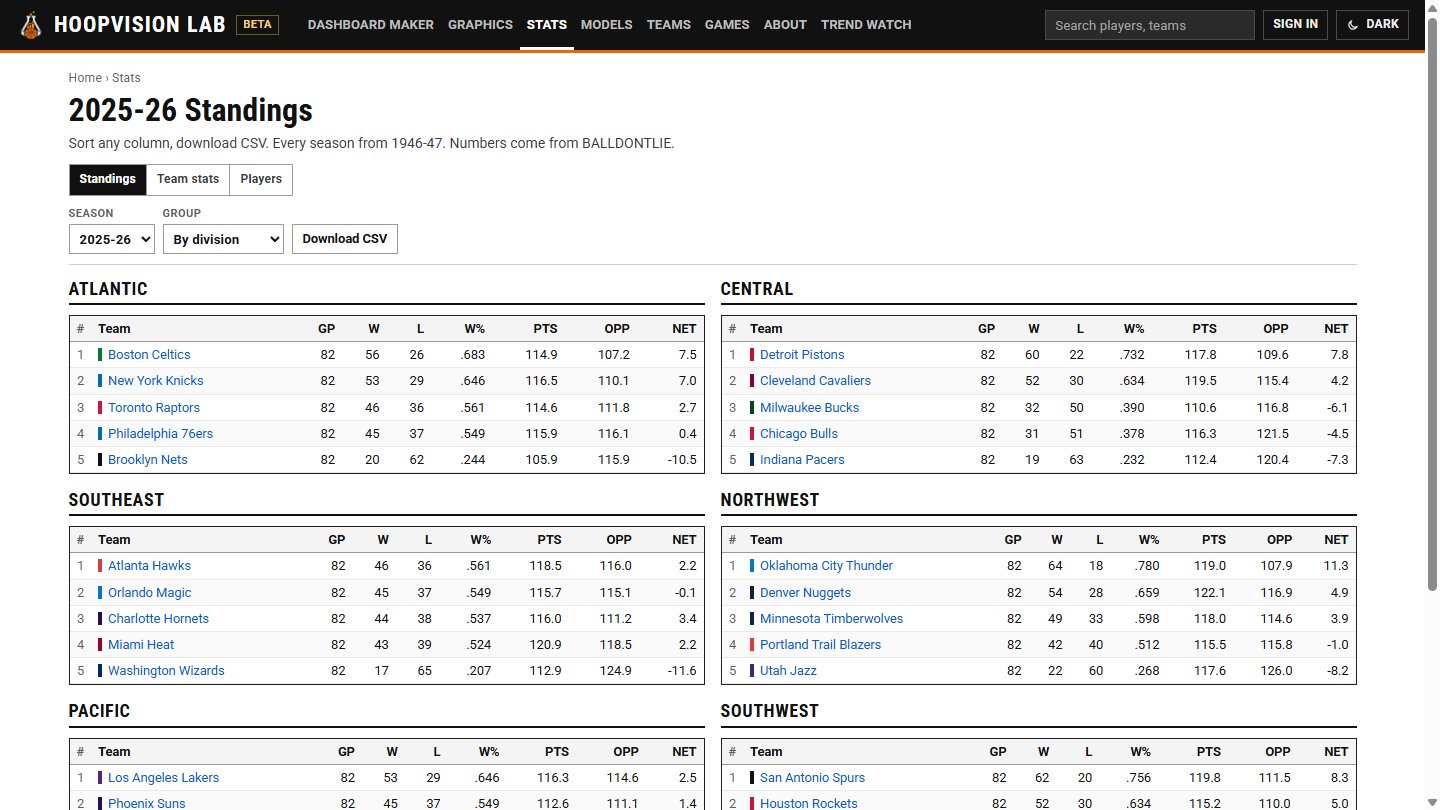
Around the dashboard maker are the pages a stats fan expects: standings and player tables you can sort, a page for every team with its season summed up in plain English and the seasons in history most like it, and a page for every game that tells its story — who decided it, the difference, the series — over a stack of charts.
It runs on the same engine as its sister sites for baseball and hockey, so a fix made once reaches all three.
What it does
- Type a sentence, get a dashboard; follow up to change it
- Questions answered in a sentence on top of the board
- Every season since 1946-47, regular season and playoffs
- Playoff series and rounds worked out from the games
- Whole-board follow-ups: "vs the Knicks" or "on the road" narrows every widget at once
- Game pages that tell the story over a stack of charts
- Standings, team stats and player tables, sortable
- Team pages with the season in brief and its closest matches in history
- Spider charts ranking a team against the league, up to three teams at once
- A graphics maker for broadcast-style comparison cards
- Edit mode with copy and paste; share links, board themes and picture export