
Prairie Falcons — Defensive Dashboard
A stats dashboard for a high school football staff: type in a box score, or paste one out of a spreadsheet, and it becomes leaderboards, trends, a page per player, a page per game, and a plain-English read on what the numbers say.
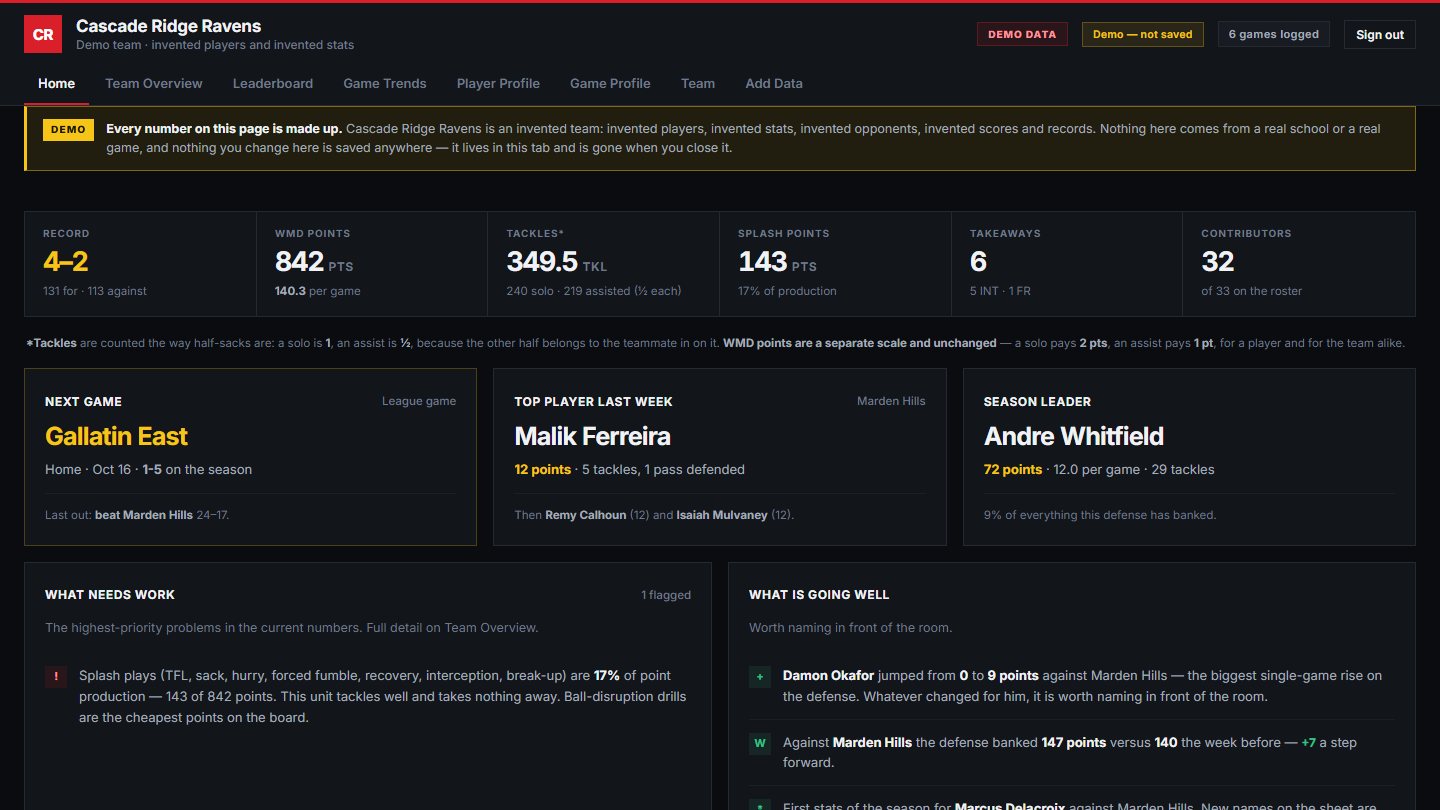
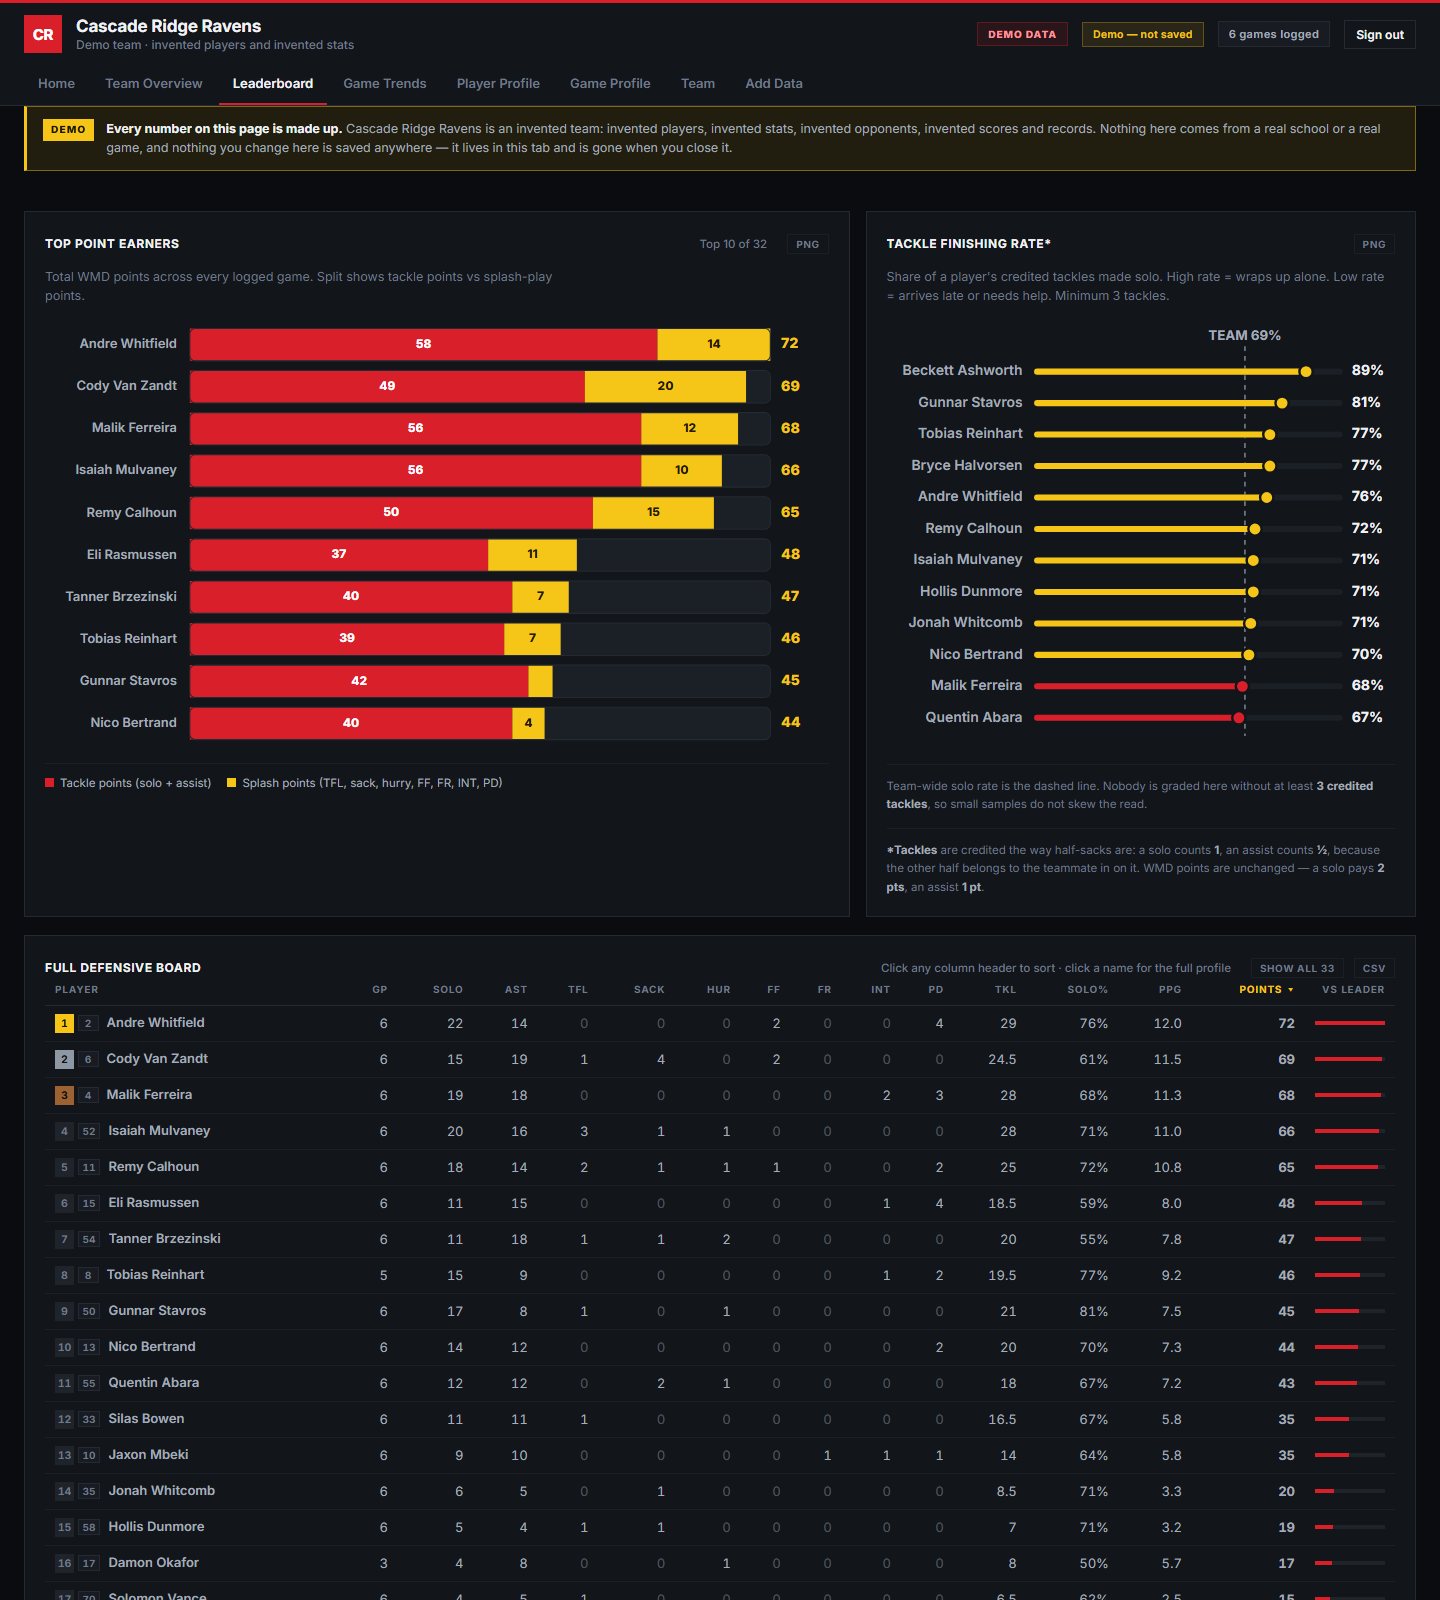
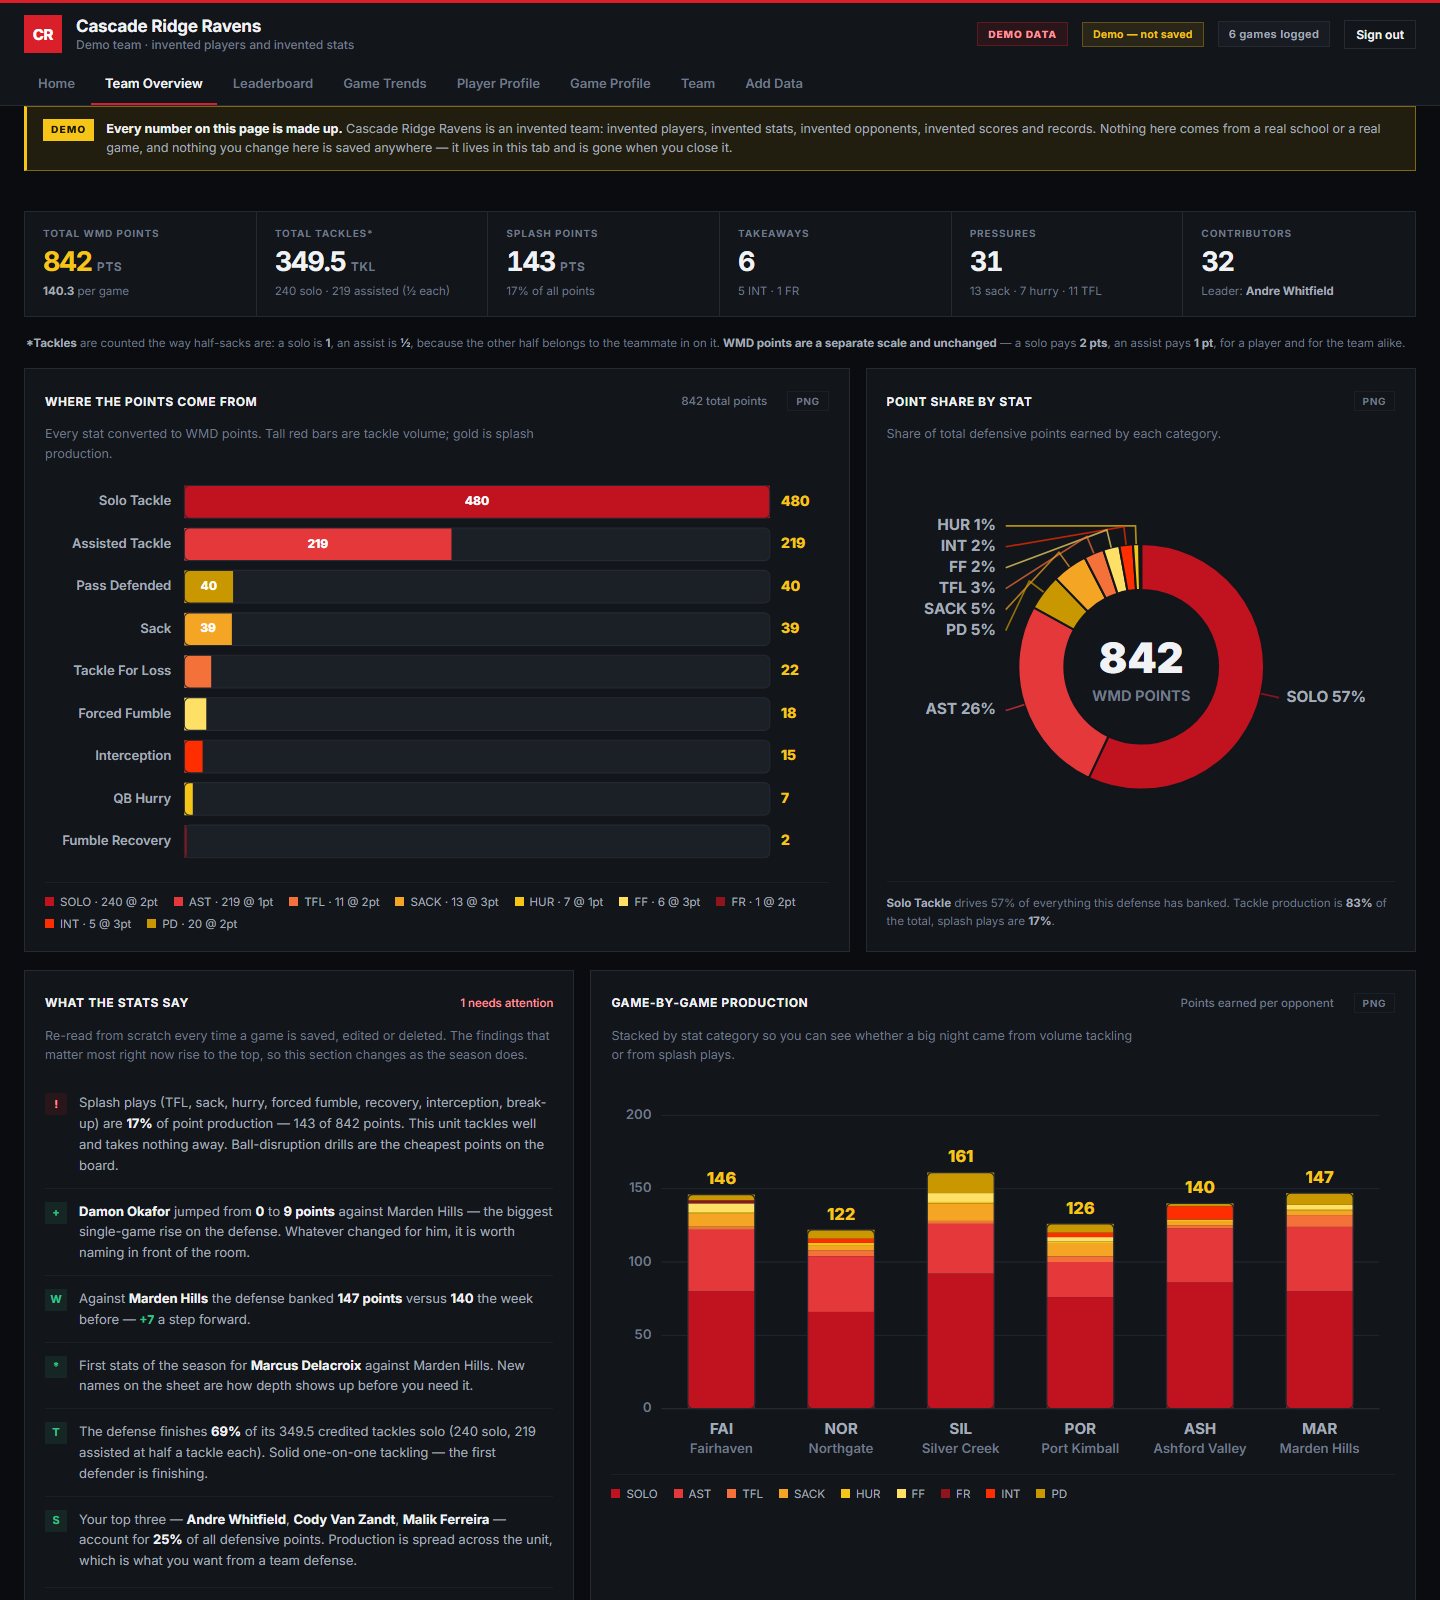
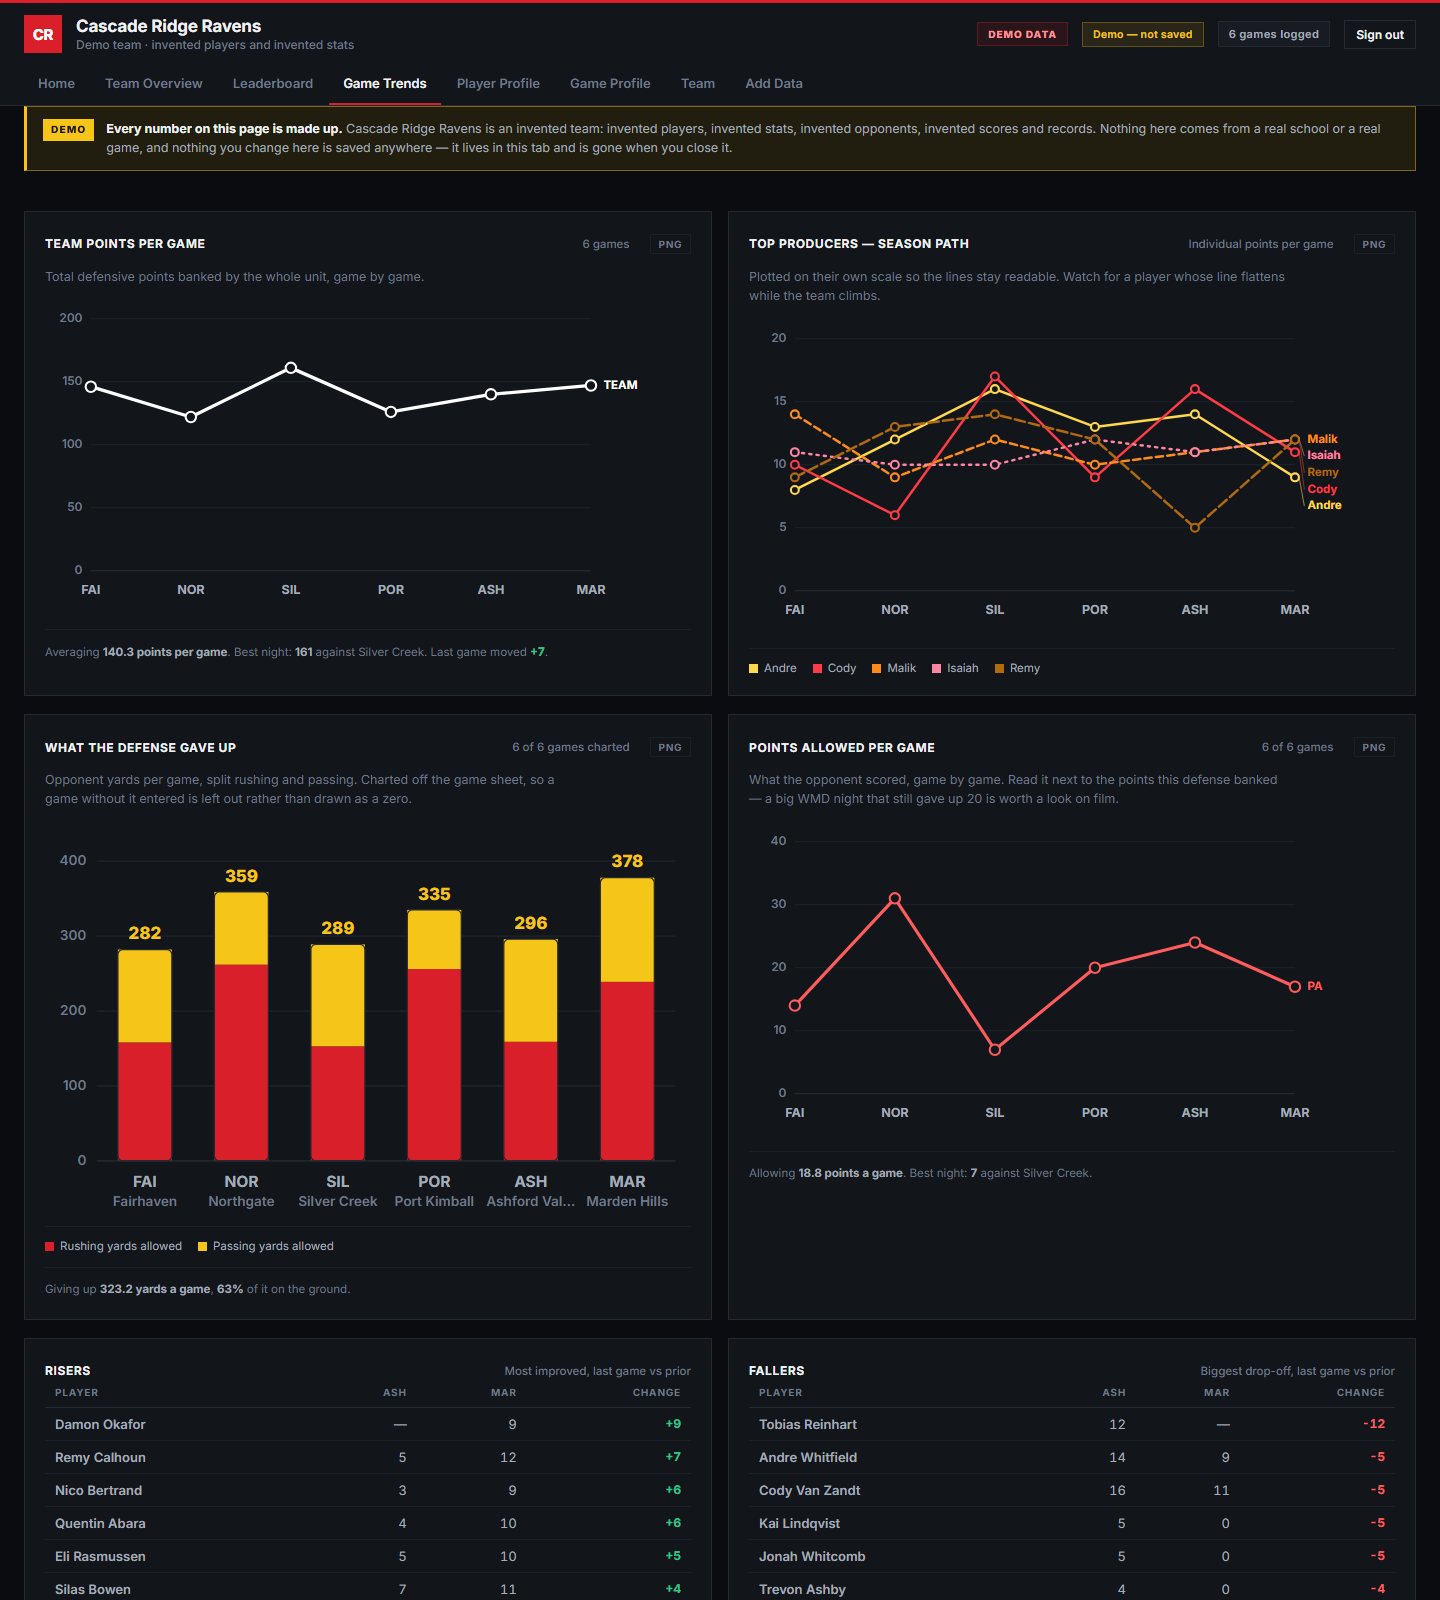
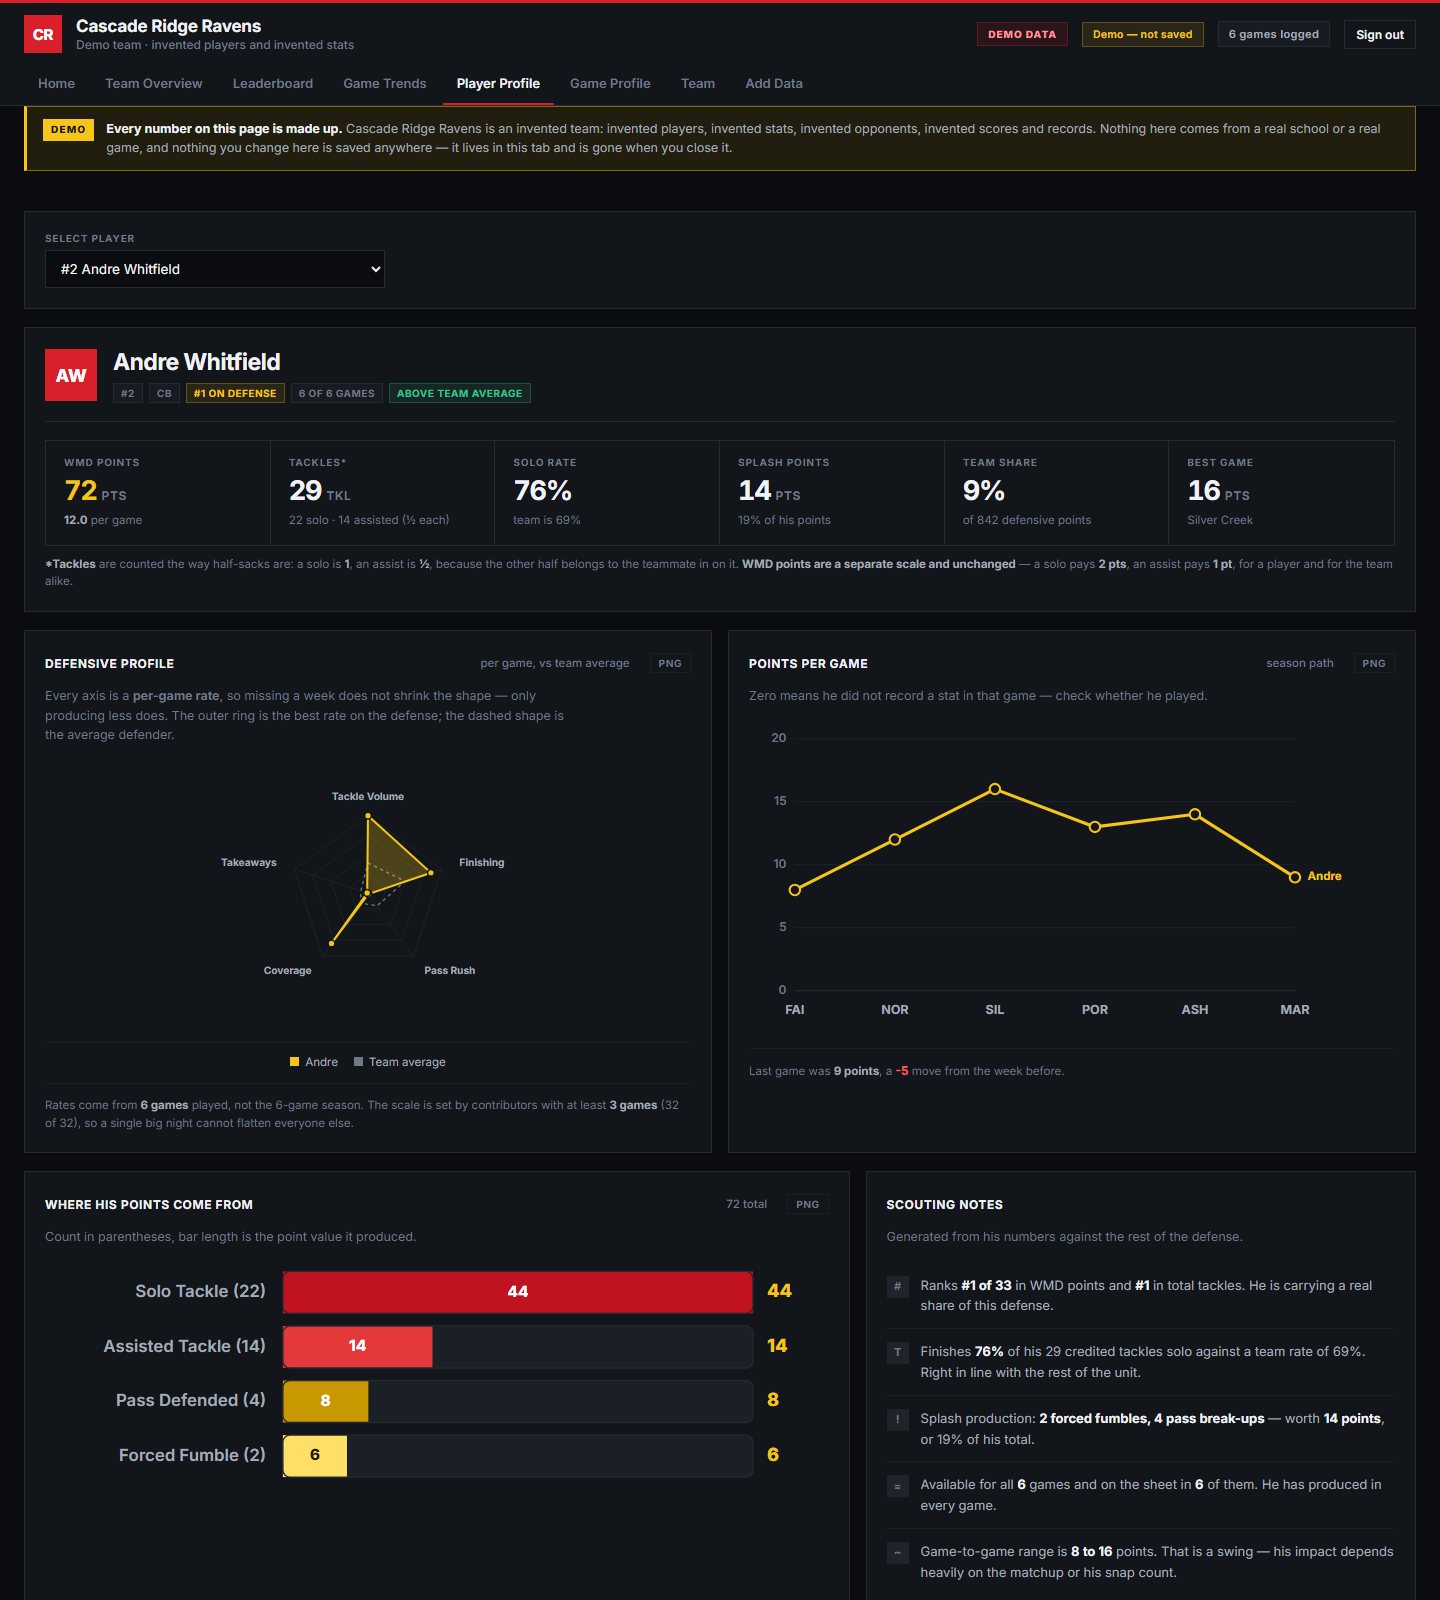
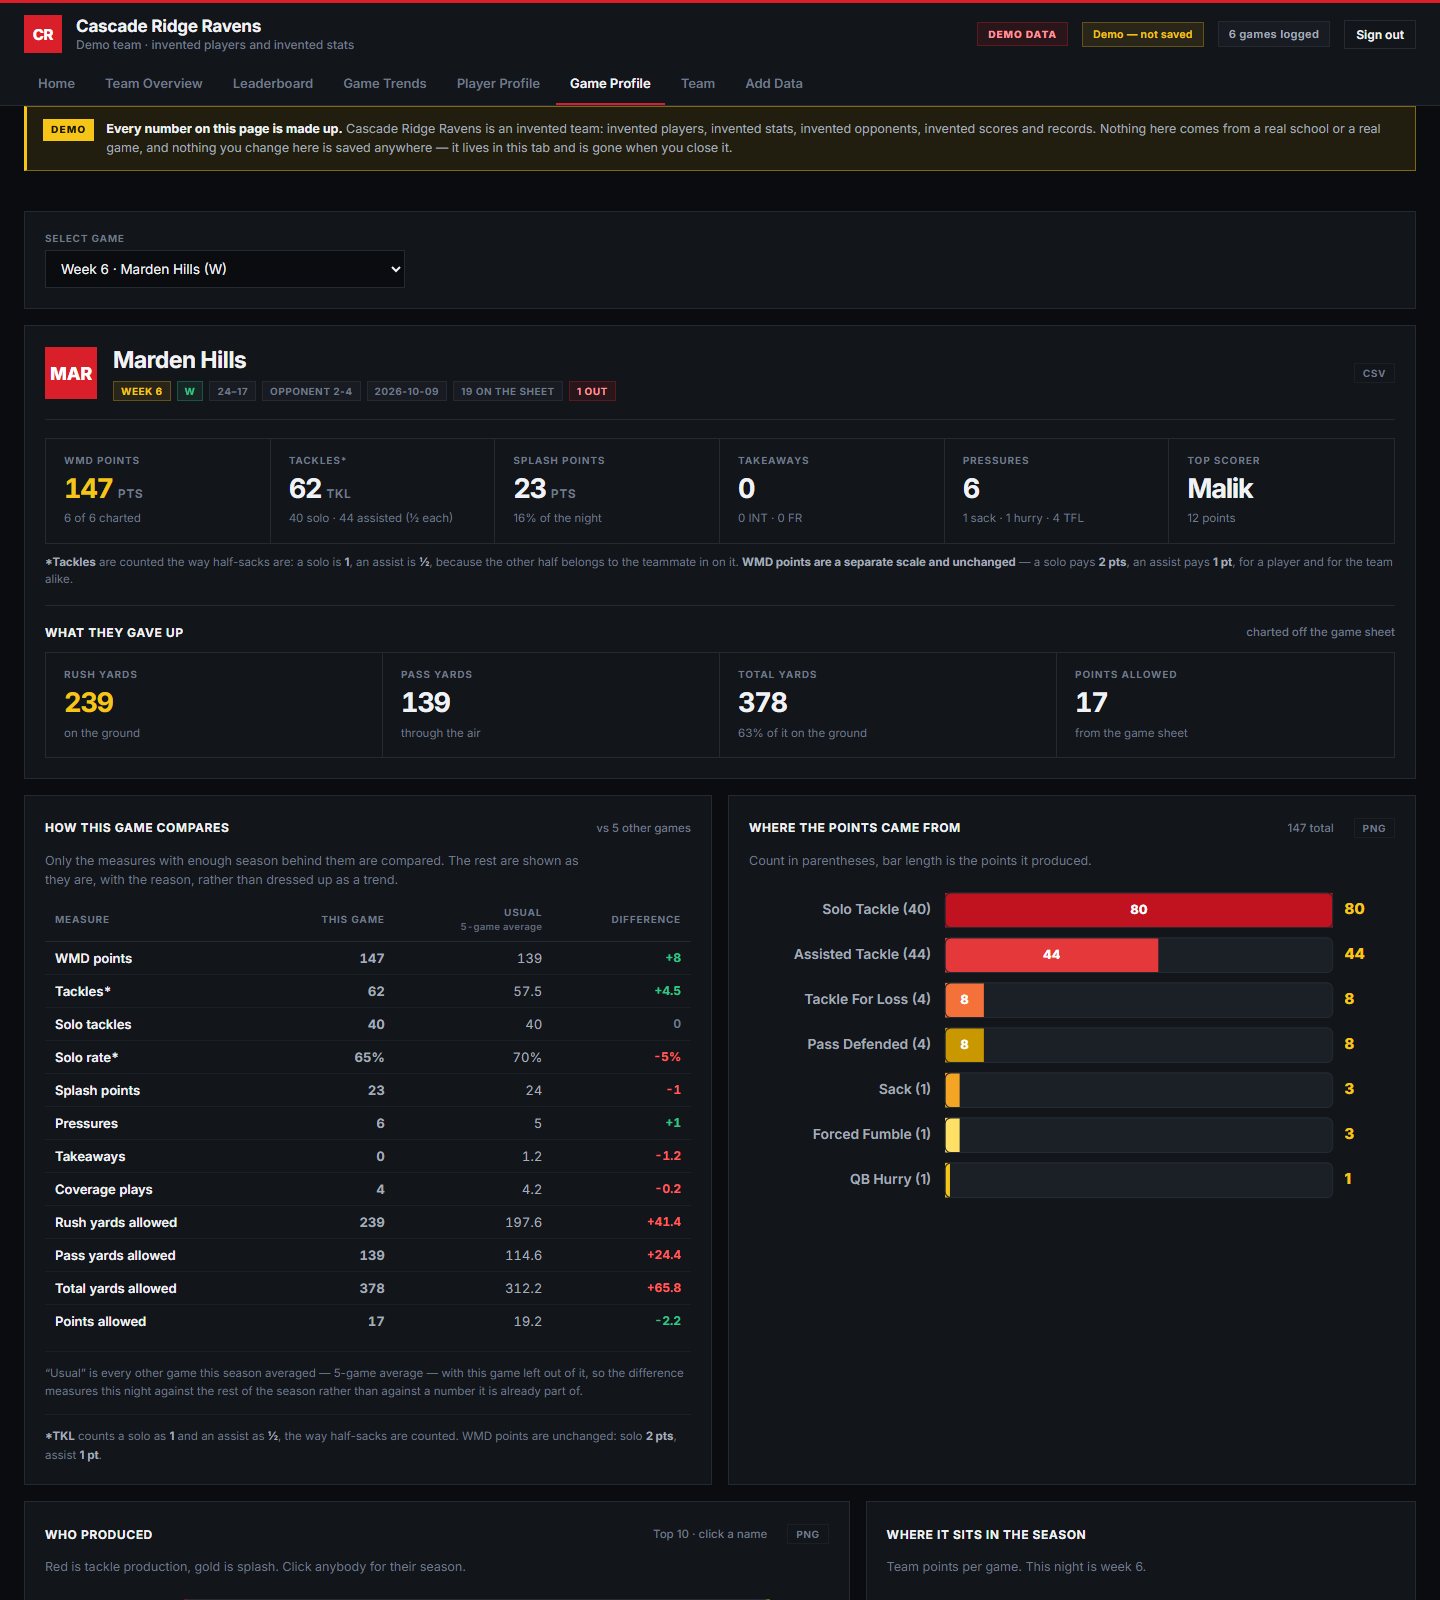
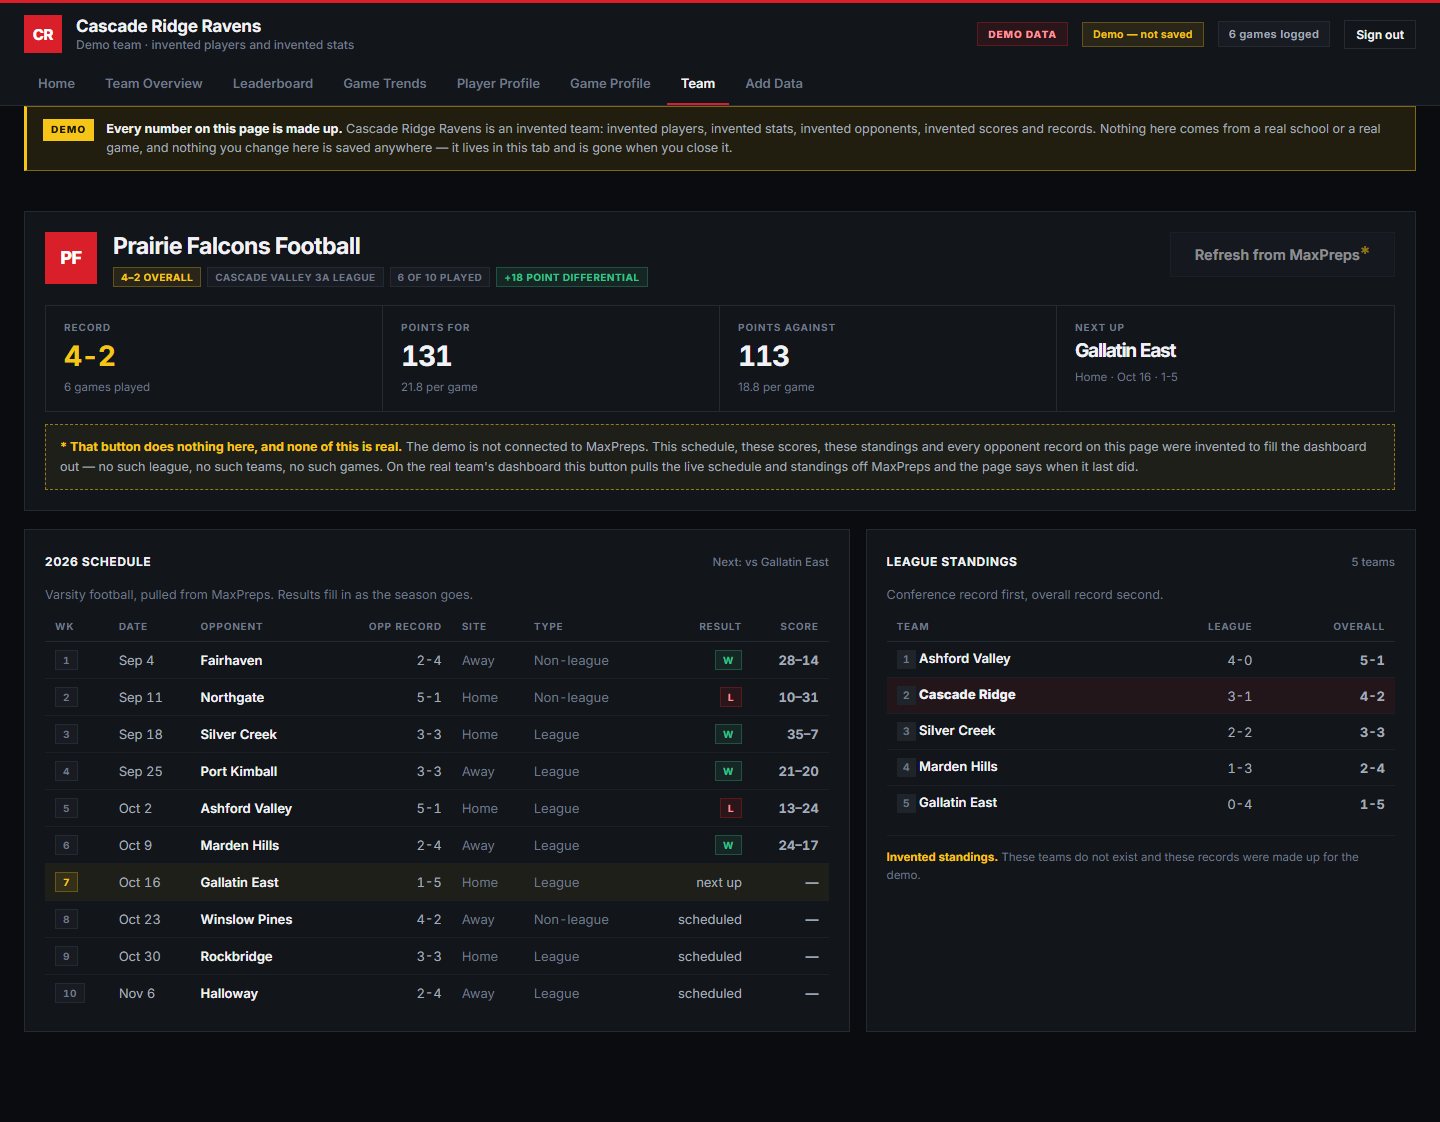
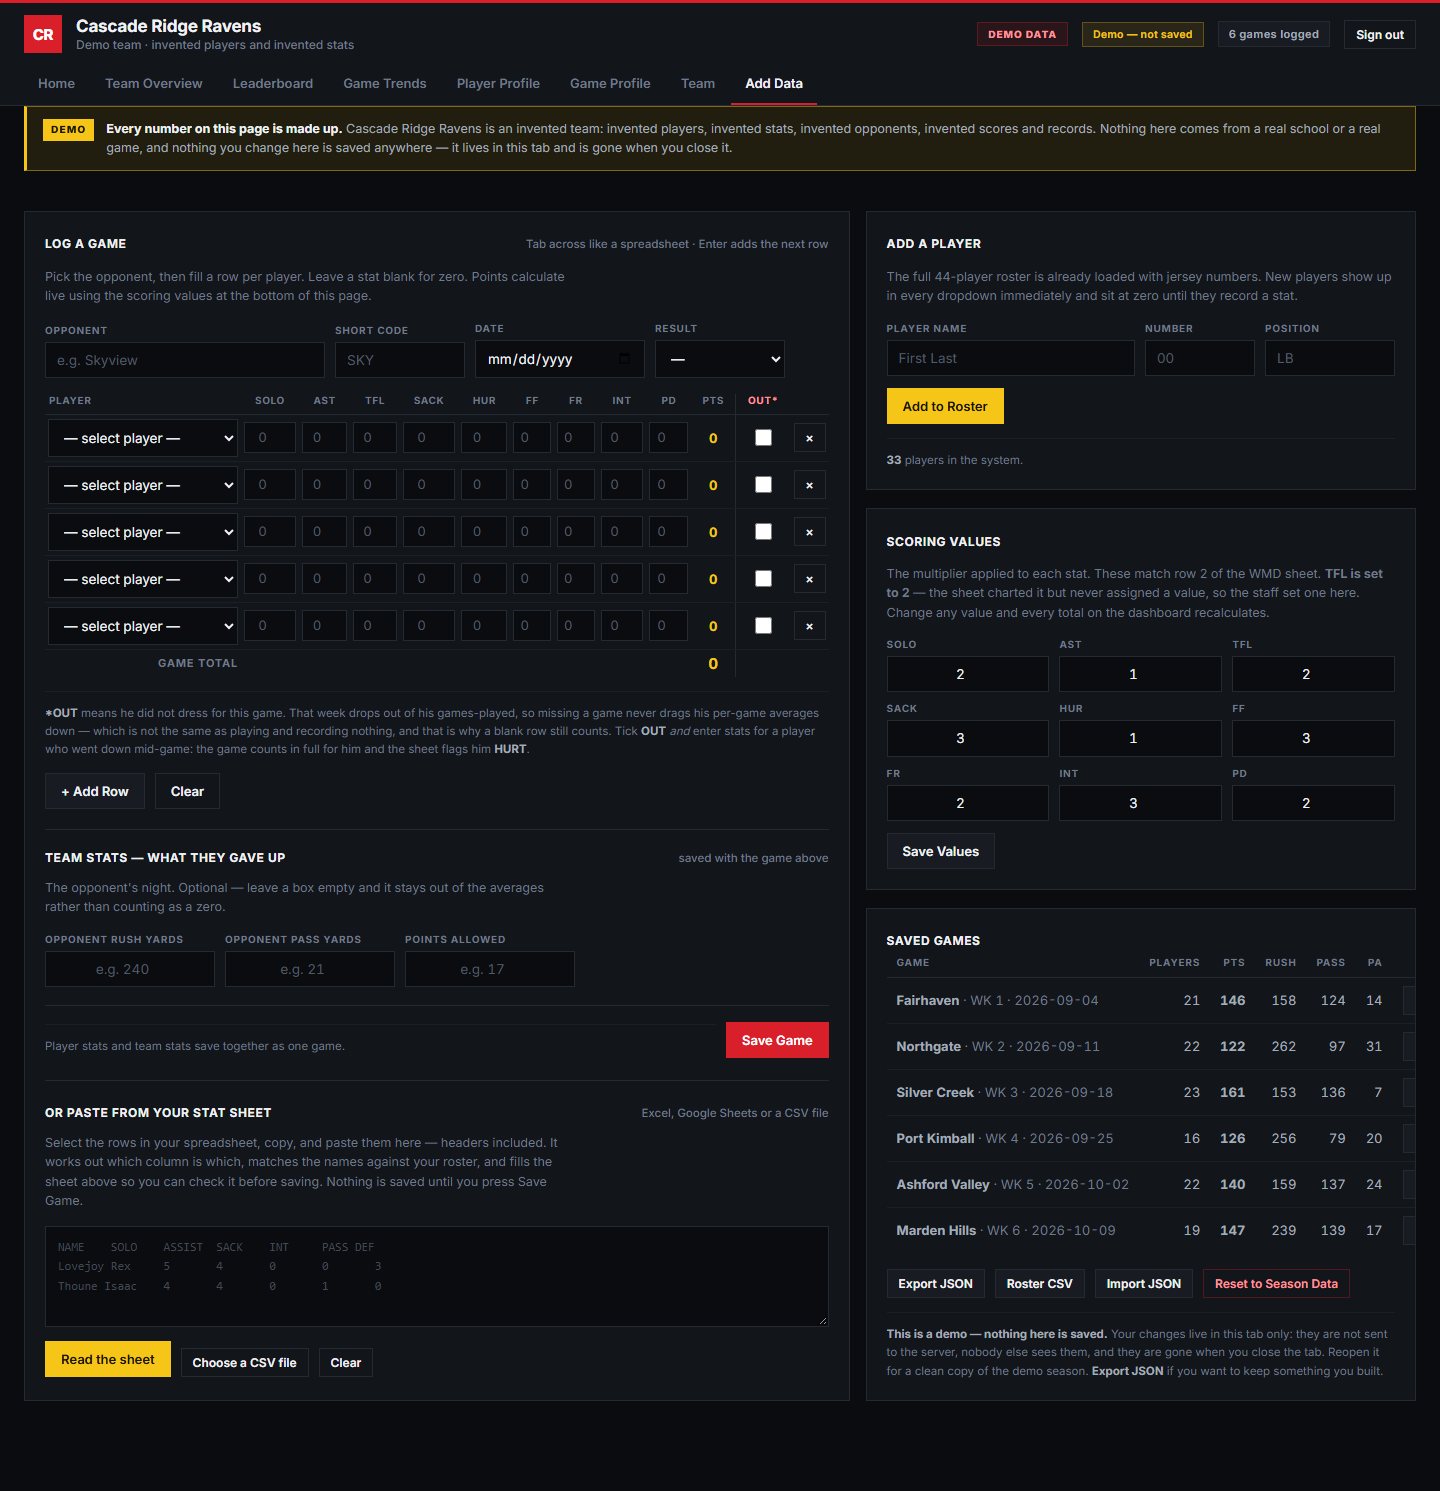
Prairie's coaches were tracking defensive production on a spreadsheet, using a points system they had already worked out. The spreadsheet was good at holding numbers and no use at answering questions — who is actually producing, what is getting worse, and whether a bad week is a real drop or just a quiet game.
This reads the same numbers back as answers. Every player gets a page, every game gets a page, and the home screen opens with what needs work and what is going well, written in sentences rather than left for somebody to spot in a table.
The part I am most pleased with is what it refuses to say. It only compares a number against the rest of the season when there is enough season behind it, and how much is enough depends on what is being measured: points and tackles settle down quickly, while big one-off plays and takeaways are rare enough that a single play drags the average around. Anything that has not earned a comparison is shown as a plain number with the reason, rather than dressed up as a trend. On the first game of the year it compares nothing at all, and says so. A dashboard that sounds confident when it has no business being confident is worse than no dashboard.
Getting data in had to be easy or it would not happen. Paste a sheet out of Excel and it works out the shape of it — finds the header row under a title, ignores a totals line, knows that AST and Assisted Tackles are the same column, and matches names against the roster loosely enough to catch a typo while refusing to guess between two players who share a surname. It reports every match it made and fills in the entry form rather than saving anything, so a coach still checks it. The schedule, the standings and each opponent's current record update themselves weekly.
One more thing worth knowing: the same site serves a second, invented team, so the dashboard can be shown to anybody without putting real students' numbers on a screen. These screenshots are that demo team.
What it does
- Type a box score, or paste one straight out of Excel
- Reads the shape of a pasted sheet — headers, totals rows, differently-named columns
- Matches names against the roster and reports every match rather than guessing silently
- A page per player and a page per game, with per-game rates
- Leaderboards, trends, and a written read on what needs work
- Refuses to call something a trend until there is enough season behind it
- Mark a player out for a game, so a missed week does not drag his averages down
- Schedule, standings and opponents' records update themselves weekly
- Two people editing at once cannot silently overwrite each other
- Every save kept in history, so a bad edit is recoverable
- A separate invented team for demos, so real students' numbers stay private
- Signs in with a passcode and stays signed in for a month
Want one like this?
This was built, launched and is looked after by me. Packages and prices are published — read them before you talk to me.